
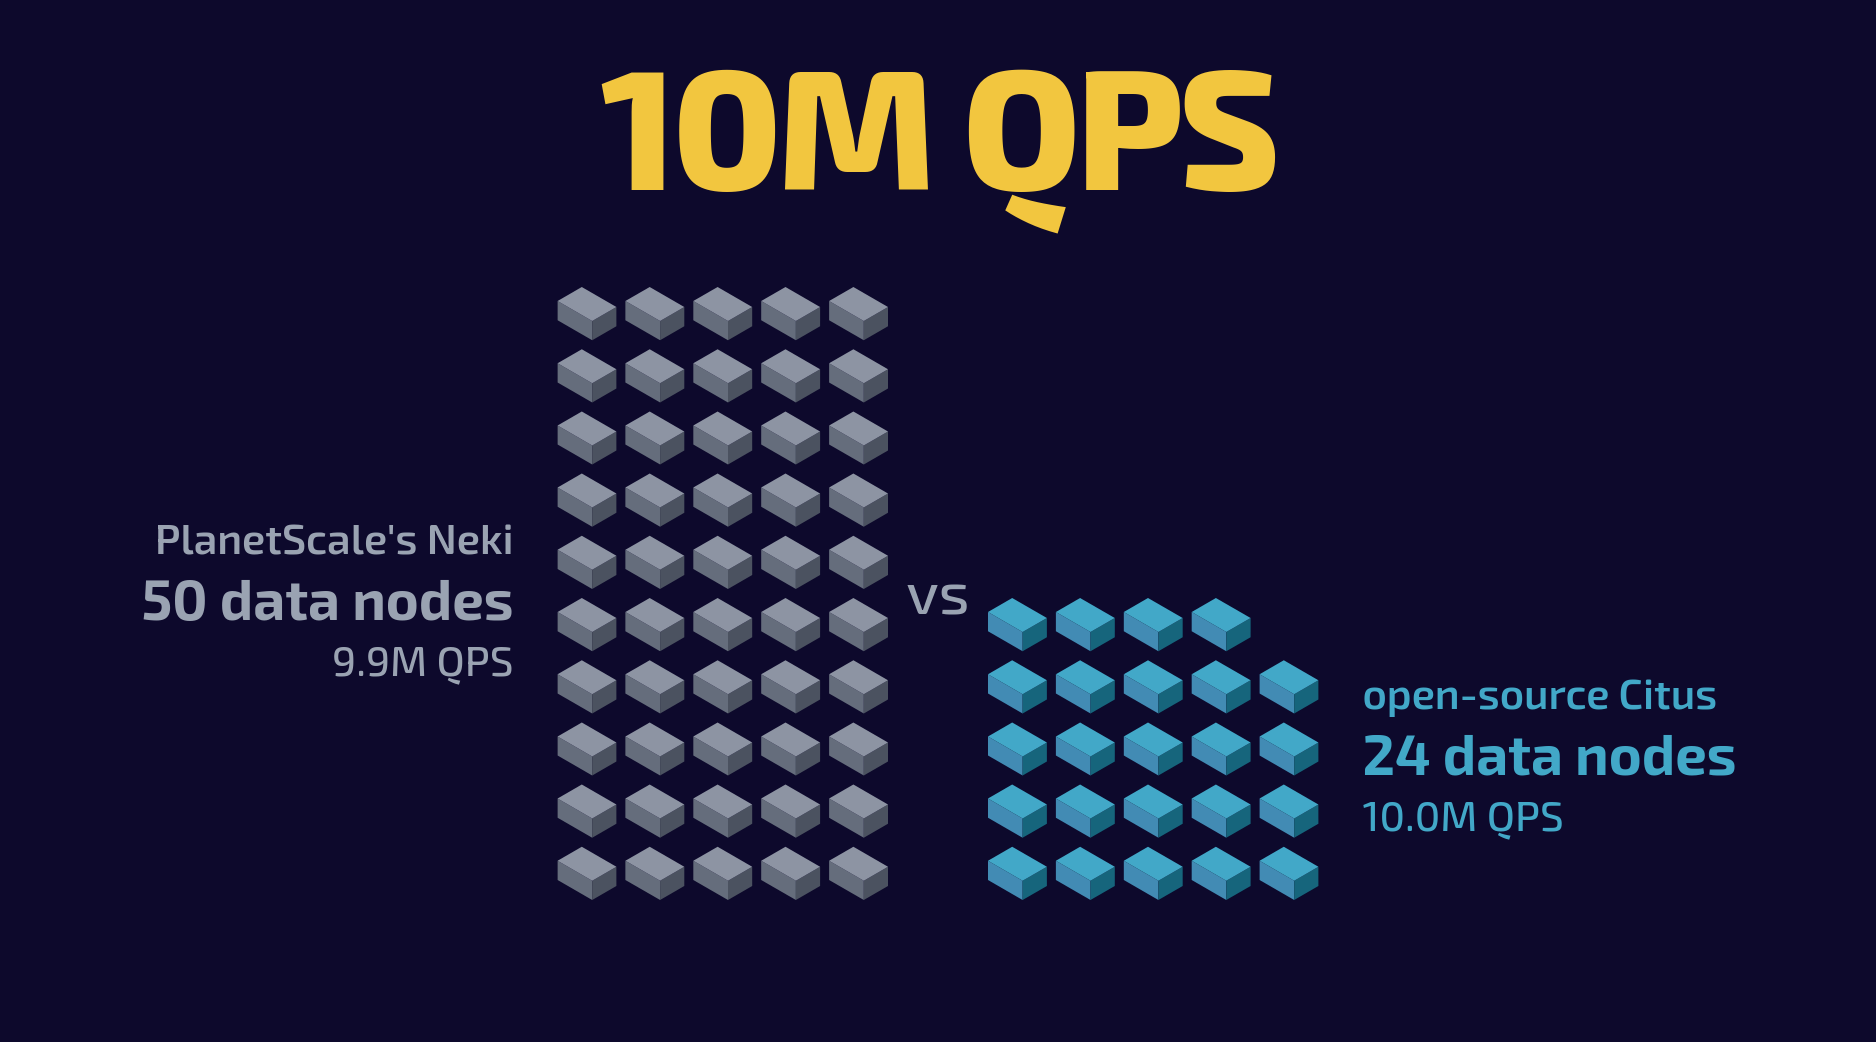
Open-source Citus delivers millions of queries per second more efficiently than Neki, the only other published data point at this scale
Last month PlanetScale published a blog post on how they achieved 118 million queries per second on Neki, their sharded Postgres. It included data points at 5, 50 and 512 shards, and showed the scalability between them.
While this was breaking news, our team at StackGres was working on a benchmark to show how we removed Citus' single-coordinator ceiling, allowing Citus to scale without limits. We introduced an architecture in StackGres 1.19 that allows to create as many Query Routers (think of Citus Coordinators, but you can scale them out) as you need. Query Routers scaled near-linearly up to two routers, allowing a three worker cluster to go from 550K queries per second with a single coordinator to 1.4M with three Query Routers.
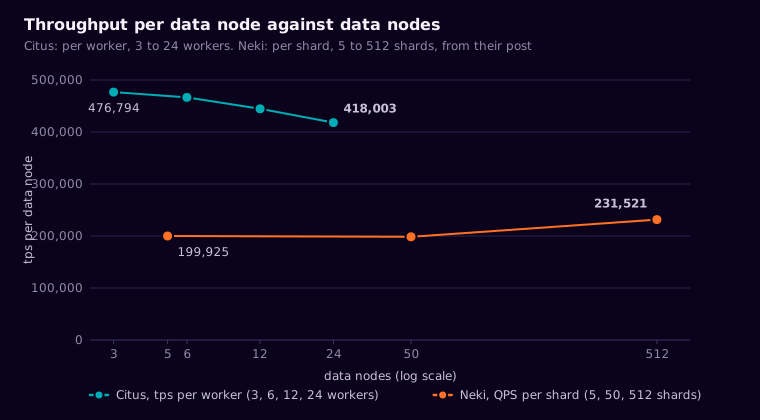
The question then became obvious: can we compare Neki and Citus? Can Citus match, or outperform, with the new Query Routers, Neki? One observation further motivated us: Neki’s numbers show that data nodes were delivering 231K tps. A trained eye would soon recognize that figure as a low per node number for a modern ARM64 server with 64 cores. Certainly there’s overhead on a sharded system, and both Neki and Citus suffer from it. But we believed Citus could do better.
And so it did. We matched the 1M and 10M data points. At those data points Citus was able to achieve slightly better performance (with possibly lower latency too, but those numbers were not drilled down in Neki’s post) with 60% and 48% of the data nodes, respectively. The number of Query Routers was half of Neki’s at 1M and the same at 10M. Overall, Neki needed 1.5 to 1.8 times the vCPU to reach Citus performance levels.
Our benchmark was created as similar as possible to Neki’s, but they haven’t published all the details about their setup. Our benchmark setup, but also all the code needed to reproduce it anywhere, will be published soon as a follow-up blog post, so that anyone could verify our claims. There’s further discussion on this blog post about the methodology, results and caveats. And one question that we leave open: could we have continued scaling Citus to more than 100M tps?
The benchmark
Make no mistake. Achieving 118M qps is no small feat. It really shows what the technology is able to do, and the team behind it. Yet we knew that Citus, with the new Query Routers functionality that we introduced in StackGres, also scaled very well and it’s very performant. We also know that Citus is well established and mature. We don’t know whether other Postgres sharding solutions can reach this scale (at this performance levels). If so, we would love to see these solutions joining the public discussion and publish their benchmarks (ideally, with their frameworks to reproduce them).
We ran the same shape of workload on Citus, open source, on StackGres on EKS: single-row primary-key reads, no writes, no cross-shard queries; 2.43 TB of data per worker; primaries only, no replicas; one Citus cluster with one coordinator and multiple workers and query routers.
Four pgbench scripts, each one single-row primary-key SELECT, read-only, weighted as shown:
hot.sql      @80   SELECT abalance FROM pgbench_accounts WHERE aid = :aid   -- aid in the top hot_pct=5% of the keyspace
uniform.sql  @10   SELECT abalance FROM pgbench_accounts WHERE aid = :aid   -- aid uniform over all rows
tellers.sql  @5    SELECT tbalance FROM pgbench_tellers  WHERE tid = :tid   -- reference table
branches.sql @5    SELECT bbalance FROM pgbench_branches WHERE bid = :bid   -- reference table
pgbench -n -M prepared -c 400 -j 16 \
        -D naccounts=<count(*)> -D hot_pct=5 --log --sampling-rate=0.01
One pgbench per router, 400 clients and 16 threads each, straight to the router’s Postgres on port 5433; two routers per generator pod. The hot set is a contiguous 5% of the rows, about 121 GB per worker of heap and index, which fits the 128 GB of shared buffers plus the page cache. Latency percentiles come from the 1% sampled log; the average from pgbench’s own summary. Every run is also checked for aborted pgbench clients, and every result here has 0.
Software: PostgreSQL 18.4 (OnGres build), Citus 14.1.0, PgBouncer 1.26.0, StackGres 1.19.3, EKS 1.31, Graviton4 (arm64) throughout, all nodes in one availability zone, worker data on the instance store (2 × 1.9 TB NVMe, RAID0). pg_ash sampling every second, cgroup CPU counters and Prometheus stayed on during the runs.
Hardware: r8gd.16xlarge for the worker nodes, the same Graviton4 CPU and 64 vCPU as Neki’s r8g.16xlarge, but with local NVMe disks instead of network storage; c8g.8xlarge (32 vCPU) for the query routers, an 8xlarge like Neki’s (whose instance family is not published).
The results
Here’s how Citus, on StackGres, scaled. We first tuned a set consisting of three workers (equivalent to Neki’s data nodes) and six routers and called this a “unit of scale”. This combination can already drive more than 1.4M tps. And then created multiples of this unit of scale. Throughput below is the mean of the repetitions of each rung.
| workers | routers | clients | tps | scalability | efficiency | p50 ms | p95 ms | p99 ms |
|---|---|---|---|---|---|---|---|---|
| 3 | 6 | 2,400 | 1,430,383 | 1.00× | 100.0% | 1.30 | 3.87 | 5.67 |
| 6 | 12 | 4,800 | 2,799,476 | 1.96× | 97.9% | 1.24 | 4.21 | 6.31 |
| 12 | 24 | 9,600 | 5,335,422 | 3.73× | 93.3% | 1.08 | 5.78 | 10.81 |
| 24 | 48 | 19,200 | 10,032,084 | 7.01× | 87.7% | 1.06 | 6.46 | 11.07 |
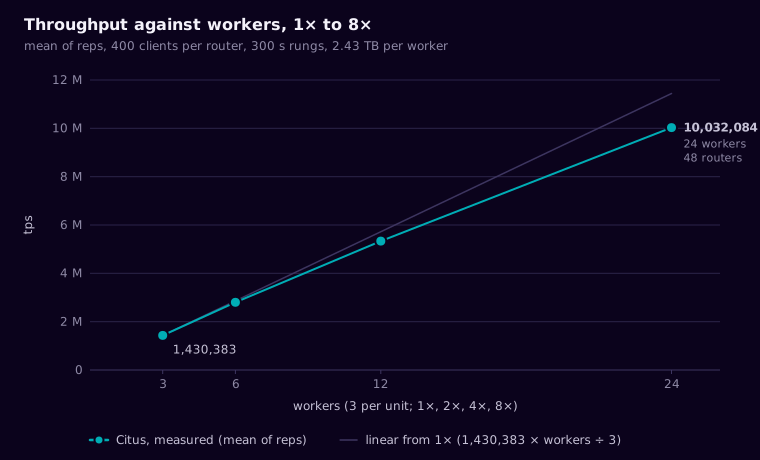
As it can be seen, Citus scales almost linearly, and keeps a p50 latency in the order of 1ms, which is really impressive when even driving 10M tps. Note that latency here is end-to-end (measured from the client’s perspective). Citus achieved 10 million transactions per second with 24 workers and 48 query routers, a total of 3,072 cores.
How do these numbers compare with the data points that Neki published? We have the 1.4M and the 10M results that we can compare with Neki:
| Neki, 5 shards | Citus @ 1M | ratio | |
|---|---|---|---|
| throughput | 999,624 QPS | 1,430,383 tps | 1.43× |
| data nodes | 5 | 3 | 0.60× |
| query routers | 12 | 6 | 0.50× |
| total database vCPU | 704 | 384 | 0.55× |
| tps per data node | 199,925 | 476,794 | 2.38× |
And at 10M:
| Neki, 50 shards | Citus @ 10M | ratio | |
|---|---|---|---|
| throughput | 9,923,900 QPS | 10,032,084 tps | 1.01× |
| data nodes | 50 | 24 | 0.48× |
| query routers | 48 | 48 | 1.00× |
| total database vCPU | 4,736 | 3,072 | 0.65× |
| tps per data node | 198,478 | 418,003 | 2.11× |
Data nodes are 64 vCPU each on both sides. Neki’s routers are “8xlarge” in their post, assumed 32 vCPU each. Our single coordinator, 4 vCPU, is left out of the totals.
The price
Neki’s post publishes no cost, but PlanetScale’s pricing page does. Yet we wanted to do a pricing exercise and compare both solutions. A Neki shard PS-5120 (64 vCPU, 512 GiB) is $17,250 per month, sold only as a highly available cluster of one primary and two replicas on network storage; additional replicas are $5,750 each, and there is no primary-only option. Routers are billed per branch at a rate covering the three-router baseline, one per availability zone; the largest SKU, NKR-640 (27 vCPU, 38.75 GiB), is $5,260 per month per baseline of three. So we did some exercise to extrapolate the exact hardware used in the benchmark for the pricing calculation. If there is any mistake, we’ll update the post to stand corrected.
Our figure is the EC2 instances cost. And highlighted are the results for instances under an EC2 Instance Savings Plan, as it’s hard to imagine running a sharded database workload on on-demand instances.
| per month (730 h) | 1M tps | 10M tps |
|---|---|---|
| Neki shards, HA | 5 × $17,250 = $86,250 | 50 × $17,250 = $862,500 |
| Neki routers | 4 × NKR-640 = $21,040 | 16 × NKR-640 = $84,160 |
| Neki list price, HA | $107,290 | $946,660 |
| Neki, primary-only equivalent | $49,790 | $371,660 |
| Citus (primaries only, on-demand) | $16,159 | $127,240 |
| Citus, Savings Plan | $10,349 | $81,449 |
| Neki list price (HA) ÷ Citus SP | 10.4× | 11.6× |
| Neki primary-only ÷ Citus SP | 4.8× | 4.6× |
| $ per 1,000 tps-month: Neki as sold / Neki primary-only / Citus SP | $107 / $50 / $7.2 | $95 / $37 / $8.1 |
In essence, for roughly the same workload, Citus is around 5 times cheaper than Neki (4.6 to 4.8×). That is against a primary-only equivalent that we built from their list prices, since Neki is only sold with two replicas per shard; against Neki as sold, Citus is 10 to 12 times cheaper. This is a combination of two factors: more performance per data node, and the managed service fee that PlanetScale adds on top of the instance cost.
This is arguable. However, StackGres is the software equivalent of a managed service. Managed services are not managed by humans, but rather by software. Same with StackGres. The only difference is that you have humans for support if something goes wrong. StackGres also offers an Enterprise subscription to cover the same.
Benchmark cost: PlanetScale’s CEO said on Hacker News that their run cost $250,000, achieving 118M QPS. At StackGres, we’re a bootstrapped startup, and we can’t spend that much money on a benchmark ;) So we had to be much more capital efficient, and not aim for the top scalability. So far we have spent around $6,000 to achieve the results being published today.
Next steps
We will publish a follow-up blog post explaining in more detail how we achieved these numbers, how we scaled Citus to 10M tps. To be clear, it was not easy. It involved mostly connection management sizing and smart use of connection pools.
We will also publish the full source code to reproduce our benchmarks. Not only we believe in this transparency being needed when publishing a benchmark; but we also want others to be able to reproduce our numbers. Or even better: to try to multiply further our “unit of scale” and test Citus at much higher throughput!
Disclaimer
We don’t claim the benchmarks are identical. We have done our best to match them as closely as possible, but there are certain differences and decisions that we disclose for full transparency:
- Storage. Neki’s shards ran on r8g.16xlarge, which has no local disks, so their data was on network storage (EBS); ours is on local NVMe. It’s their choice: a 2.44 TiB shard fits the instance store of r8gd.16xlarge, the same machine with local disks. It favours us, most of all in tail latency, and the cost comparison carries it. But most of the queries are served from memory. We didn’t choose EBS because of the time the whole benchmark takes to run, loading and warming up 2.43 TB per node, which drives the cost up notably.
- Latency. Neki published latency only for 512 shards: router p50 0.96 ms and p99 6.06 ms, client p99 13.95 ms. Ours is client-side at every scale, with in-zone generators.
- Run length. They sustained 118.5 M for 16 minutes. Our rungs are 300 s after a 900 s warm-up at the same load. Reason: cost. But note that benchmark duration is not that important here, as there are no writes (and therefore no checkpoints, notable autovacuum activity, etc).
- Shard definition. A Neki shard is one Postgres primary. Ours is a worker node holding several Citus shards (20, 10, 5 or 3).
- Total data. We fixed the amount of data per node to match Neki’s (2.43 TB against their 2.44 TiB). Since Citus needed fewer nodes for the same throughput, the total database is smaller: 58 TB against their 134 TB at 10M. The per-node comparison is the fair one.
- Cache hit. Neki’s 87.3% is “reads served from cache” on their 512-shard dashboard; our 92% is the Postgres shared buffers hit ratio alone, which doesn’t count the OS page cache. The two are not comparable.
- Errors. Theirs is 67 per second at 512 shards. Ours is 0 failed transactions and 0 aborted clients in every valid rung.