Create the more advanced Cluster
We’re now completely ready to create a more “advanced” cluster. The main differences from the one created before will be:
- That we have explicitly set the size (t-shirt size) of the cluster.
- We have custom Postgres and connection pooling (PgBouncer) configurations.
- It will have automated backups, based on the backup configuration.
- It will export metrics to Prometheus automatically. Grafana dashboards will be visible from the embedded pane in the Web Console.
- Logs will be sent to the distributed logs server, which will in turn show them in the Web Console.
Create the file sgcluster-cluster1.yaml and apply the following YAML file:
apiVersion: stackgres.io/v1
kind: SGCluster
metadata:
  namespace: demo
  name: cluster
spec:
  postgres:
    version: 'latest'
  instances: 3
  sgInstanceProfile: 'size-small'
  pods:
    persistentVolume:
      size: '10Gi'
  configurations:
    sgPostgresConfig: 'pgconfig1'
    sgPoolingConfig: 'poolconfig1'
    sgBackupConfig: 'backupconfig1'
  distributedLogs:
    sgDistributedLogs: 'distributedlogs'
  prometheusAutobind: true
  nonProductionOptions:
    disableClusterPodAntiAffinity: true
and deploy to Kubernetes:
kubectl apply -f sgcluster-cluster1.yaml
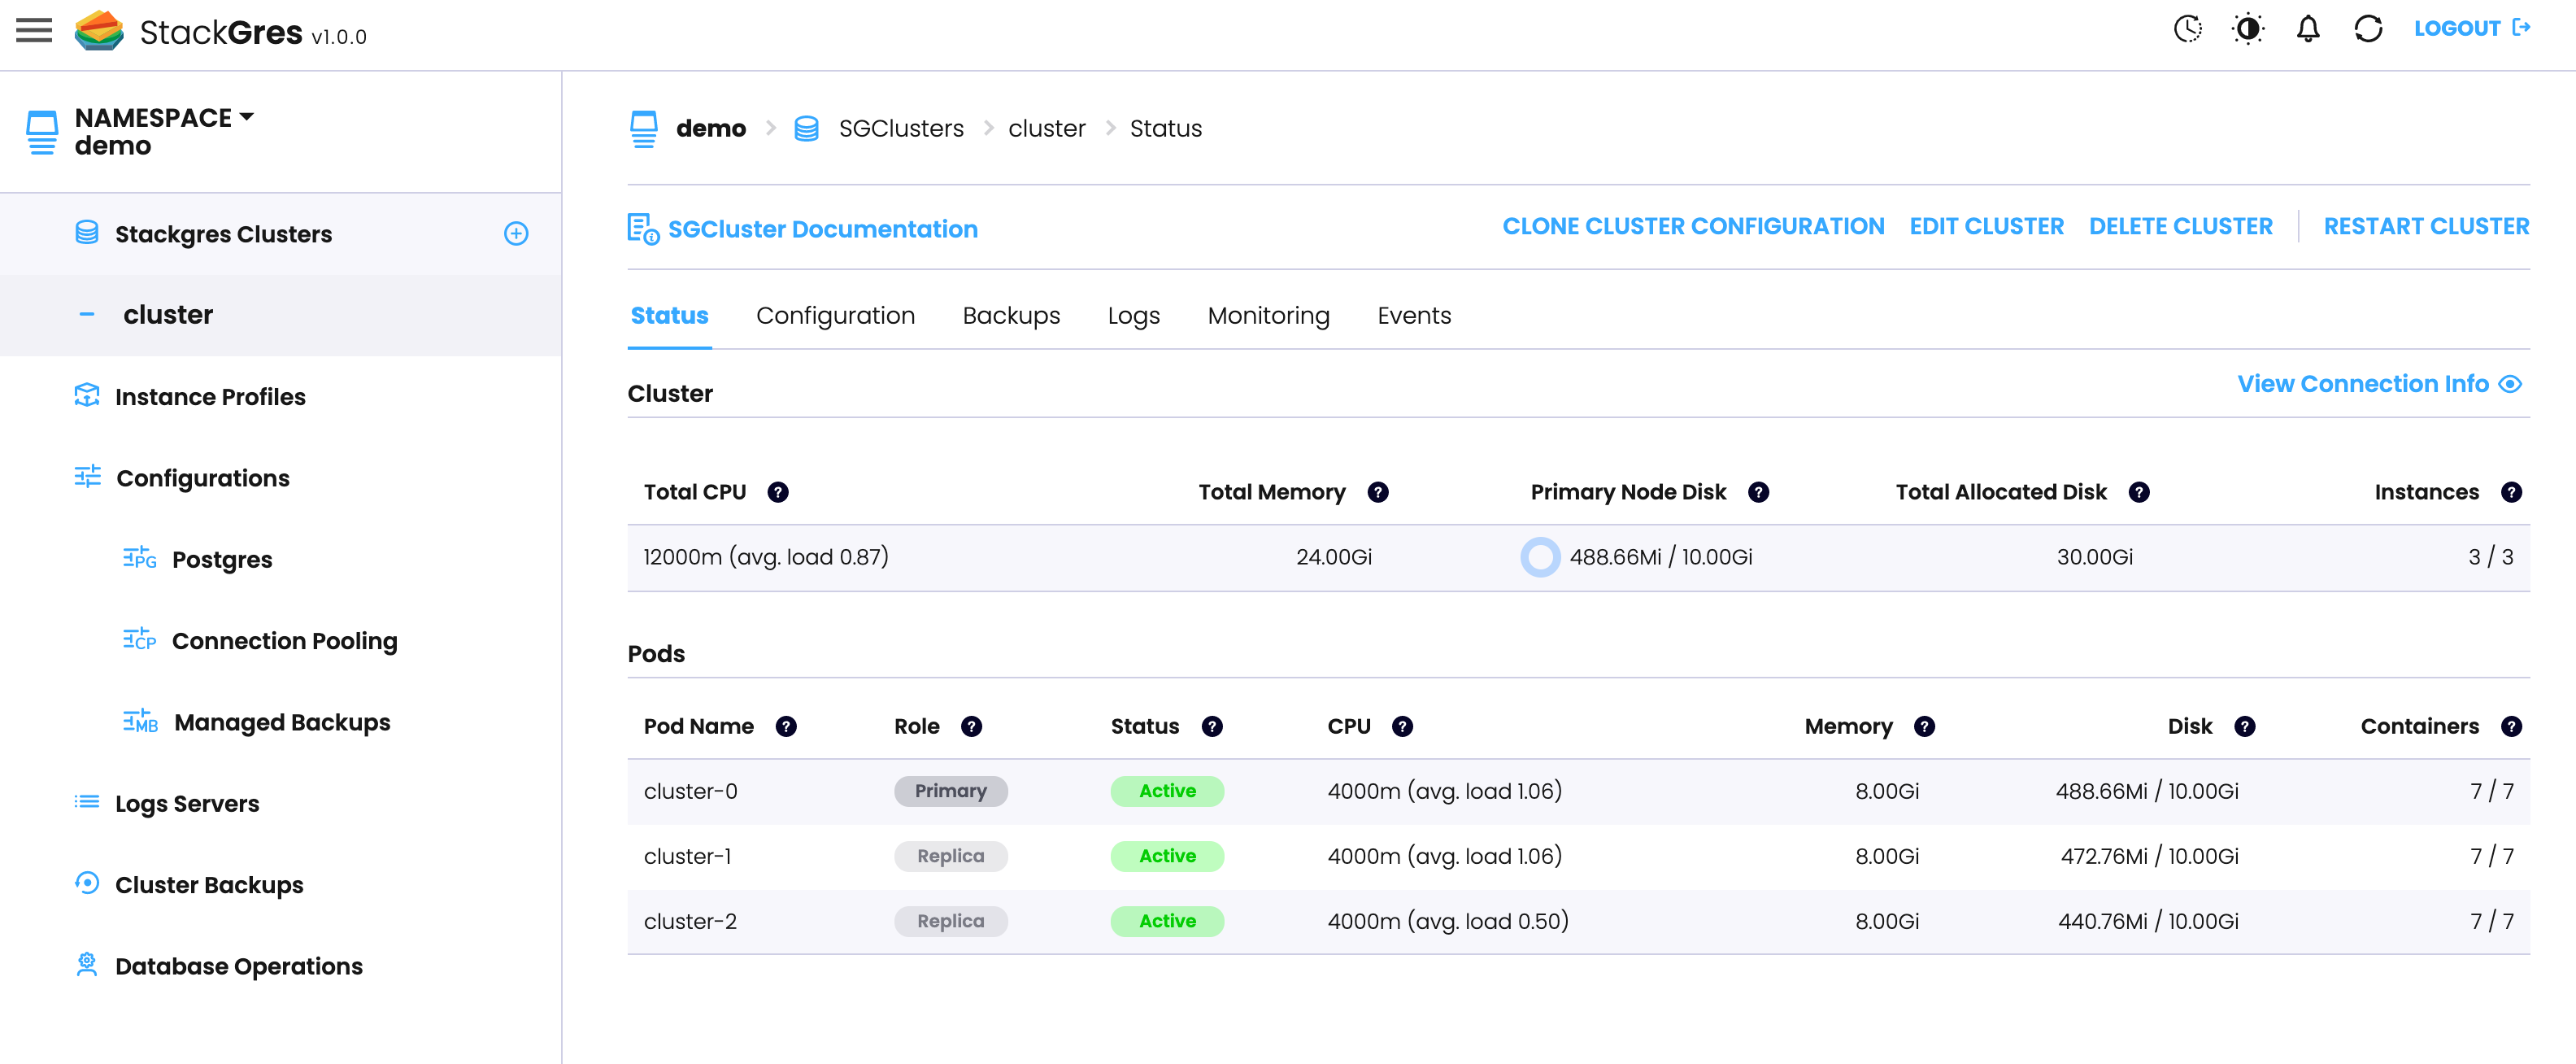
You may notice that in this ocassion the pods contain one extra container. This is due to the agent (FluentBit) used to export the logs to the distributed logs server. You can check both from kubectl -n demo get pods --watch:
$ kubectl -n demo get pods
NAME                          READY   STATUS    RESTARTS   AGE
distributedlogs-0             3/3     Running   0          3m16s
hol-0                         7/7     Running   0          98s
hol-1                         7/7     Running   0          72s
as well as kubectl -n demo describe sgcluster cluster and the Web Console the status of the newly created cluster.
From the Web Console:

While the cluster is being created, you may notice a blip on the distributed logs server, where a container is restarted. This is a normal process, and does only pause temporarily the collection of logs (no logs are lost, since they are buffered on the source pods). This is caused by a re-configuration which requires a container restart.