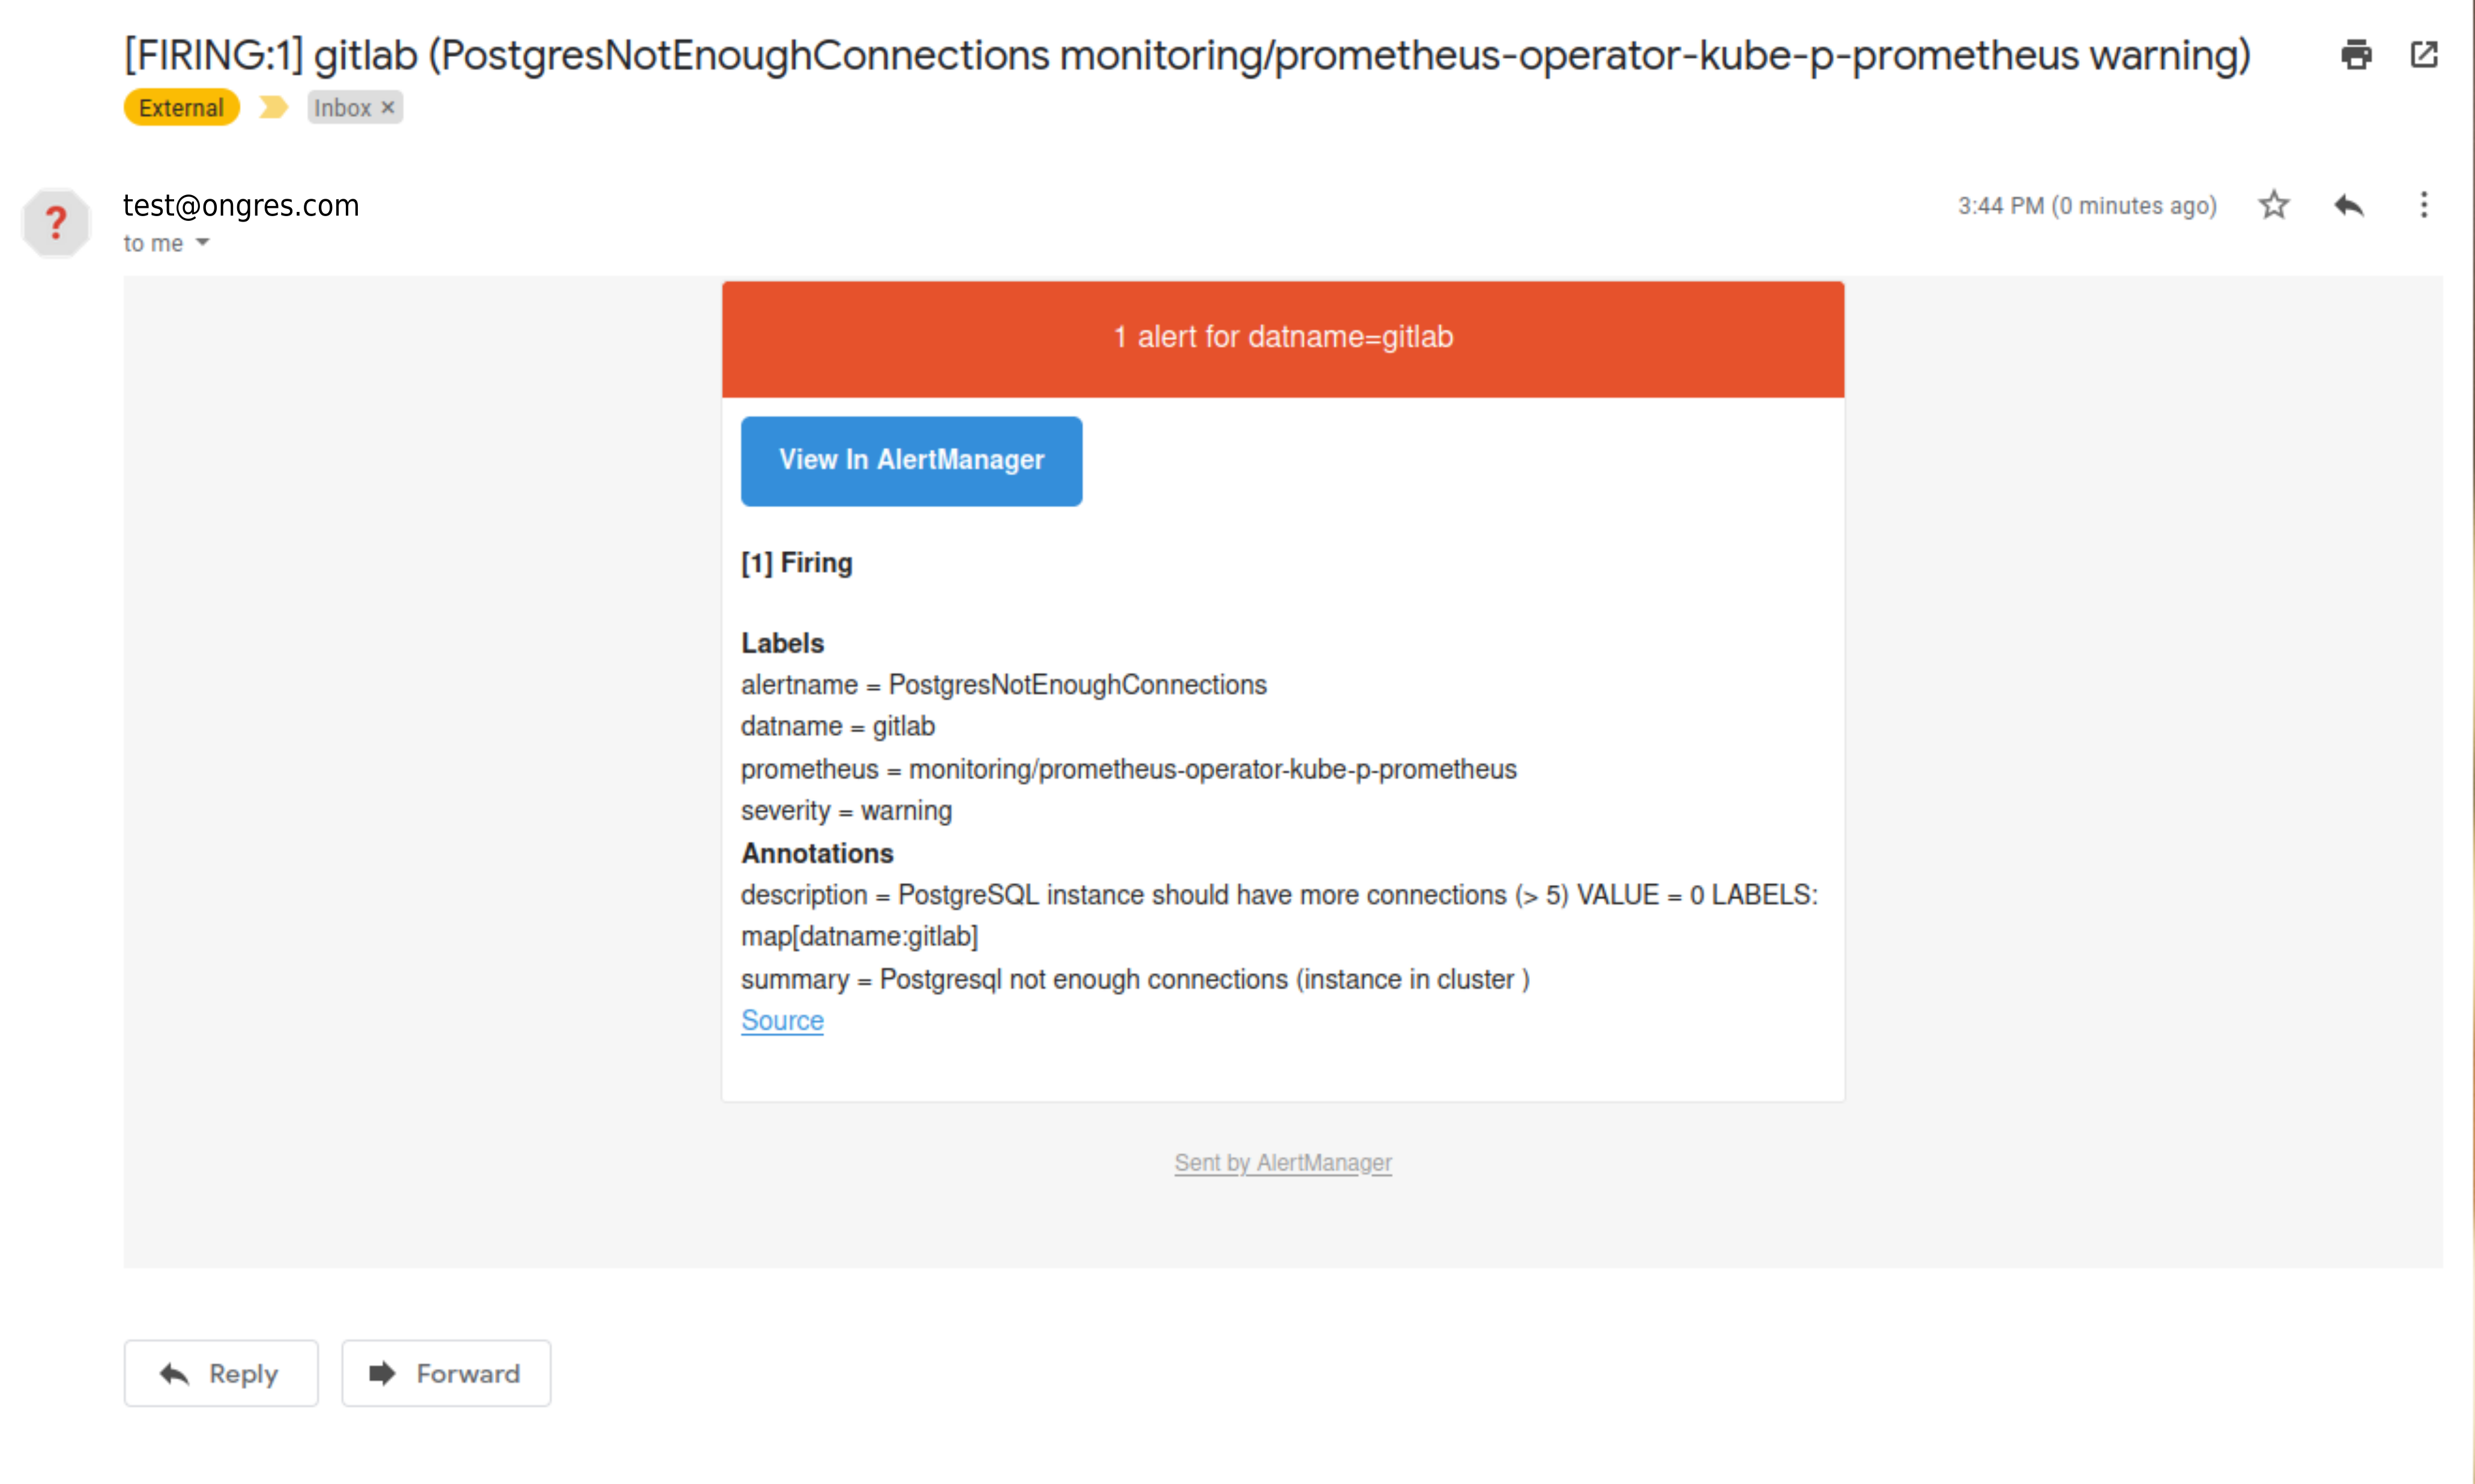
Postgres Alerts
This runbook will show you how to add Postgres alerts to your Prometheus installation, and will give you examples of useful alerts.
Environment
This runbook will show you how to add Postgres alerts using a default Prometheus installation with kube-prometheus-stack.
The Prometheus installation will add some CRDs to your Kubernetes cluster:
$ kubectl get crd -o name | grep monitoring
customresourcedefinition.apiextensions.k8s.io/alertmanagerconfigs.monitoring.coreos.com
customresourcedefinition.apiextensions.k8s.io/alertmanagers.monitoring.coreos.com
customresourcedefinition.apiextensions.k8s.io/podmonitors.monitoring.coreos.com
customresourcedefinition.apiextensions.k8s.io/probes.monitoring.coreos.com
customresourcedefinition.apiextensions.k8s.io/prometheuses.monitoring.coreos.com
customresourcedefinition.apiextensions.k8s.io/prometheusrules.monitoring.coreos.com
customresourcedefinition.apiextensions.k8s.io/servicemonitors.monitoring.coreos.com
customresourcedefinition.apiextensions.k8s.io/thanosrulers.monitoring.coreos.com
Defining Alerts
The Prometheus resources allow you to add Prometheus instances and Prometheus rules.
The Prometheus rules define your alerts using promql with some other required parameters.
This is an example rule:
- alert: PostgresInstanceDown
      expr: pg_up == 0
      for: 1m
      labels:
        severity: critical
        service: "PostgreSQL"
      annotations:
        summary: "Postgres server instance is down"
        description: "Postgres has not been responding for the past 1 minutes on {{ $labels.instance }}"
        title: "Postgres server instance {{ $labels.instance }} is down "
The expr parameter defines the Prometheus query how to retrieve the data for the alert.
The pg_up metric would return 0 if the instance is down and 1 if it is up.
The for parameter defines the threshold time evaluating the query.
You can also add labels and annotations to describe your alert more precisely.
So, the above example means If the pg_up metric value is equal to zero for 1m, then fire the alert.
Check the alerts section below for the full alerts description and YAML definitions.
Useful Alerts
These are some useful alerts that you can add to your StackGres cluster.
| Alert | Severity | Threshod | Description |
|---|---|---|---|
| PostgresExporterErrors | critical | 5m | Check the last scrape from postgres-exporter |
| PostgresInstanceDown | critical | 1m | Check is postgres service is up |
| PostgresSplitBrain | critical | 1m | Check if is more than one Read/Write instance on the cluster |
| PostgresPromotedNode | critical | 5m | Check if the replication leader was changed |
| PostgresInactiveReplicationSlots | warning | 30m | Check if there is a inactive replication slot |
| PostgresReplicationLagSizeTooLarge | warning | 5m | Check if the replication lag is increasing |
| PostgresTooManyDeadTuples | warning | 30m | Check if there are to many dead tuples |
| PostgresTooManyConnections | warning | 5m | Check if postgres connections are above 90% of max_connections |
| PostgresNotEnoughConnections | warning | 5m | Check if postgres available connections are less than 5 |
| PgBouncerWaitingClients | crititcal | 1m | Check if pgbouncer has waiting clients |
| PgBouncerNotEnoughConnections | critical | 5m | Check if pool size is not enough for the current connections |
| PgBouncerPoolFillingUp | warning | 5m | Check if pgBouncer pool is filling up |
| PgBouncerAvgWaitTimeTooHigh | warning | 5m | Check if time spent by clients waiting for a connections > 1s |
| PgBouncerQueryTimeTooHigh | warning | 5m | Check if average query duration more than 5 seconds |
| DatabaseLowDiskAvailable | warning | 15m | Check the database available disk size <= 20% |
For a default Prometheus stack installation, create the YAML file stackgres-alerts.yaml:
apiVersion: monitoring.coreos.com/v1
kind: PrometheusRule
metadata:
  labels:
    app: kube-prometheus-stack
    release: prometheus-operator
  name: stackgres-rules
  namespace: monitoring
spec:
  groups:
  - name: StackGres
    rules:
    - alert: PostgresInstanceDown
      expr: pg_up == 0
      for: 1m
      labels:
        severity: critical
        service: "PostgreSQL"
        cluster: "StackGres"
      annotations:
        summary: "Postgres server instance is down"
        description: "Postgres has not been responding for the past 1 minutes on {{ $labels.instance }}"
        title: "Postgres server instance {{ $labels.instance }} is down "
    - alert: PostgresExporterErrors
      expr: pg_exporter_last_scrape_error == 1
      for: 10m
      labels:
        severity: critical
        service: "PostgreSQL"
        cluster: "StackGres"
      annotations:
        summary: "Postgres Exporter is down or is showing errors"
        description: "postgres-exporter is not running or it is showing errors {{ $labels.instance }}"
    - alert: PostgresReplicationLagSizeTooLarge
      expr: pg_replication_status_lag_size > 1e+09
      for: 5m
      labels:
        severity: critical
        service: "PostgreSQL"
        cluster: "StackGres"
      annotations:
        summary: "Postgres replication lag size is to large"
        description: "Replication lag size on server {{$labels.instance}} ({{$labels.application_name}}) is currently {{ $value | humanize1024}}B behind the leader in cluster {{$labels.cluster_name}}"
    - alert: PostgresTooManyDeadTuples
      expr: ((pg_stat_user_tables_n_dead_tup > 1e+06) / (pg_stat_user_tables_n_live_tup + pg_stat_user_tables_n_dead_tup)) >= 0.05
      for: 30m
      labels:
        severity: warning
        service: "PostgreSQL"
        cluster: "StackGres"
      annotations:
        summary: "PostgreSQL dead tuples is too large"
        description: "The dead tuple ratio of {{$labels.relname}} on database {{$labels.datname}} is greater than 5% in cluster {{$labels.cluster_name}}"
    - alert: PostgresInactiveReplicationSlots
      expr: pg_replication_slots_active == 0
      for: 30m
      labels:
        severity: warning
        service: "PostgreSQL"
        cluster: "StackGres"
      annotations:
        summary: "There are inactive replications slots"
        description: "The are some inactive replication slots on {{$labels.instance}} in cluster {{$labels.cluster_name}}"
    - alert: PostgresSplitBrain
      expr: count by(cluster_name) (pg_replication_is_replica == 0) > 1
      for: 1m
      labels:
        severity: critical
        service: "PostgreSQL"
        cluster: "StackGres"
      annotations:
        summary: "There are more than one instance in read-write mode"
        description: "Split Brain: too many postgres databases in cluster {{$labels.cluster_name}} in read-write mode"
    - alert: PostgresTooManyConnections
      expr: sum by (datname) (pg_stat_activity_count{datname!~"template.*|postgres"}) > pg_settings_max_connections * 0.9
      for: 5m
      labels:
        severity: warning
        service: "PostgreSQL"
        cluster: "StackGres"
      annotations:
        summary: Postgresql too many connections (instance {{ $labels.instance }} in cluster {{$labels.cluster_name}})
        description: "PostgreSQL instance has too many connections\n  VALUE = {{ $value }}\n  LABELS: {{ $labels }}"
    - alert: PostgresNotEnoughConnections
      expr: sum by (datname) (pg_stat_activity_count{datname!~"template.*|postgres"}) < 5
      for: 5m
      labels:
        severity: warning
        service: "PostgreSQL"
        cluster: "StackGres"
      annotations:
        summary: Postgresql not enough connections (instance {{ $labels.instance }} in cluster {{$labels.cluster_name}})
        description: "PostgreSQL instance should have more connections (> 5)\n  VALUE = {{ $value }}\n  LABELS: {{ $labels }}"
    - alert: PostgresPromotedNode
      expr: pg_replication_is_replica and changes(pg_replication_is_replica[1m]) > 0
      for: 5m
      labels:
        severity: warning
        service: "PostgreSQL"
        cluster: "StackGres"
      annotations:
        summary: "Postgresql promoted node (instance {{ $labels.instance }}, cluster {{ $labels.cluster_name }})"
        description: "Postgresql standby server has been promoted as primary node\n  VALUE = {{ $value }}\n  LABELS: {{ $labels }}"
    # Connection Pooling alerts
    - alert: PgBouncerWaitingClients
      expr: pgbouncer_show_pools_cl_waiting > 0
      for: 5m
      labels:
        severity: warning
        service: "PgBouncer"
        cluster: "StackGres"
      annotations:
        summary: PgBouncer has waiting clients on instance {{ $labels.instance }} in cluster {{$labels.cluster_name}})
        description: "PgBouncer instance has waiting clients\n  VALUE = {{ $value }}\n  LABELS: {{ $labels }}"
    - alert: PgBouncerNotEnoughConnections
      expr: (sum by (database,instance) (pgbouncer_show_pools_cl_active{database!~"template.*|postgres|pgbouncer"}) + sum by (database, instance) (pgbouncer_show_pools_cl_waiting{database!~"template.*|postgres|pgbouncer"}))  - on (database,instance) (pgbouncer_show_databases_pool_size{database!~"template.*|postgres|pgbouncer"}) > 0
      for: 10m
      labels:
        severity: critical
        service: "PgBouncer"
        cluster: "StackGres"
      annotations:
        summary: PgBouncer pool size is not enough for the current connections on {{ $labels.instance }} in cluster {{$labels.cluster_name}})
        description: "PgBouncer is getting more connections than the pool size, extra connections = {{ $value }}"
    - alert: PgBouncerPoolFillingUp
      expr: (sum by (database,instance) (pgbouncer_show_databases_pool_size{database!~"template.*|postgres|pgbouncer"})  - on (database,instance) pgbouncer_show_databases_current_connections)  <= 15
      for: 5m
      labels:
        severity: warning
        service: "PgBouncer"
        cluster: "StackGres"
      annotations:
        summary: PgBouncer pool is filling up on {{ $labels.instance }} in cluster {{$labels.cluster_name}})
        description: "PgBouncer pool is filling up, remaining connections = {{ $value }}"
    - alert: PgBouncerAvgWaitTimeTooHigh
      expr: pgbouncer_show_stats_avg_wait_time > 1e+6
      for: 5m
      labels:
        severity: warning
        service: "PgBouncer"
        cluster: "StackGres"
      annotations:
        summary: PgBouncer time spent by clients waiting for a connections is too high on {{ $labels.instance }} in cluster {{$labels.cluster_name}})
        description: "PgBouncer wait for a server connections is too high = {{ $value }}"
    - alert: PgBouncerQueryTimeTooHigh
      expr: pgbouncer_show_stats_avg_query_time > 5e+6
      for: 5m
      labels:
        severity: warning
        service: "PgBouncer"
        cluster: "StackGres"
      annotations:
        summary: PgBouncer average query duration more than 5 seconds on {{ $labels.instance }} in cluster {{$labels.cluster_name}})
        description: "PgBouncer average query duration more than 5 seconds = {{ $value }}"
    - alert: DatabaseLowDiskAvailable
      expr: (1.0 - node_filesystem_avail_bytes{mountpoint="/var/lib/postgresql",fstype!=""} / node_filesystem_size_bytes{mountpoint="/var/lib/postgresql",fstype!=""}) * 100 >= 80
      for: 15m
      labels:
        severity: warning
        cluster: "StackGres"
      annotations:
        summary: Database disk is filling up currently have less than 20% available on {{ $labels.instance }} in cluster {{$labels.cluster_name}})
        description: "Database disk is filling up currently have less than 20%, currently occupied {{ $value }} %"
and deploy it to Kubernetes:
kubectl apply -f stackgres-alerts.yaml
Prometheus Alert Discovery
The following describes how Prometheus discovers the alerts.
The default Prometheus installation contains a few deployments:
$ kubectl get deployments.apps -n monitoring
NAME                                     READY   UP-TO-DATE   AVAILABLE   AGE
prometheus-operator-grafana              1/1     1            1           25d
prometheus-operator-kube-p-operator      1/1     1            1           25d
prometheus-operator-kube-state-metrics   1/1     1            1           25d
and a Prometheus instance:
$ kubectl get pods -n monitoring -l app=prometheus
NAME                                                 READY   STATUS    RESTARTS   AGE
prometheus-prometheus-operator-kube-p-prometheus-0   2/2     Running   0          25d
The instance defines a ruleSelector section with some labels:
$ kubectl get -n monitoring prometheus prometheus-operator-kube-p-prometheus -o yaml | grep -A3 ruleSelector
  ruleSelector:
    matchLabels:
      app: kube-prometheus-stack
      release: prometheus-operator
You need to make sure the metadata labels from your Prometheus rule match with the ruleSelector labels of your Prometheus instance.
For our example:
apiVersion: monitoring.coreos.com/v1
kind: PrometheusRule
metadata:
  labels:
    app: kube-prometheus-stack
    release: prometheus-operator
  name: stackgres-rules
  namespace: monitoring
  ...
  ...
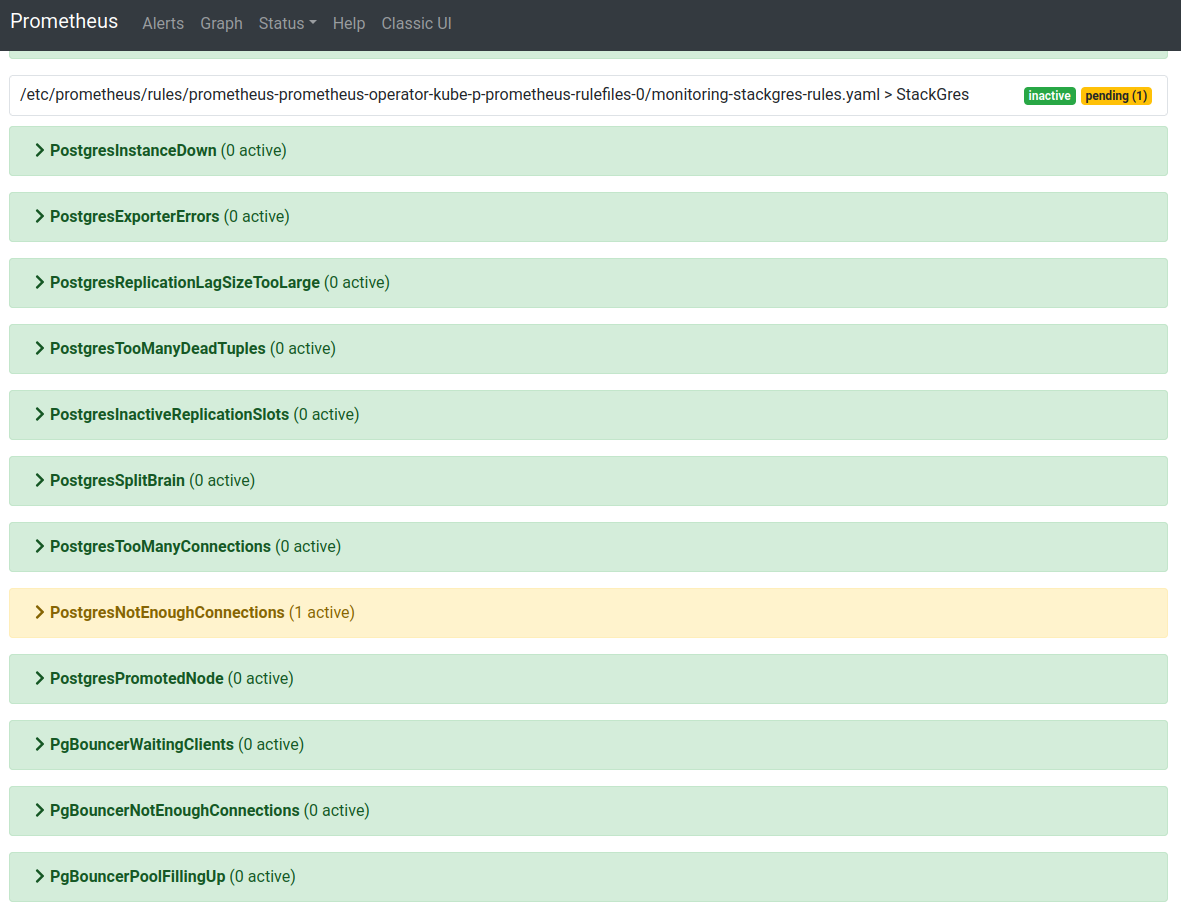
Prometheus will auto-discover the alerts according to the matching labels and add them to the instance:
Email Alerts With Alert Manager
Once you have configured the alerts on Prometheus, depending on your infrastructure, you can send messages when an alert fires. You could use email, Slack, Pagerduty, Opsgenie, and others. Check the Alert Manager Configuration for more details.
In this example, you’ll see how to configure alerts with email messages.
The Prometheus stack installation includes the Alert Manager:
$ kubectl get pods -n monitoring -l app=alertmanager
NAME                                                     READY   STATUS    RESTARTS   AGE
alertmanager-prometheus-operator-kube-p-alertmanager-0   2/2     Running   0          68m
The alerting is configured using a secret:
$ kubectl get secrets -n monitoring alertmanager-prometheus-operator-kube-p-alertmanager
NAME                                                   TYPE     DATA   AGE
alertmanager-prometheus-operator-kube-p-alertmanager   Opaque   1      30d
To update the configuration, you need to first create a file alertmanager.yaml with the following content.
Replace the users and credentials according to your needs:
global:
  resolve_timeout: 5m
route:
  receiver: 'email-alert'
  group_by: ['datname']

  routes:
  - receiver: 'email-alert'
    group_wait: 50s
    group_interval: 5m
    repeat_interval: 12h

receivers:
- name: email-alert
  email_configs:
  - to: email-group@ongres.com
    from: stackgres-alerts@ongres.com
    # Your smtp server address
    smarthost: mail.ongres.com:587
    auth_username: myuser@ongres.com
    auth_identity: myuser@ongres.com
    auth_password: XXXXXXX
Then, you need to encrypt the file contents:
$ cat alertmanager.yaml | base64 -w0
This returns a string like:
Z2xvYmFsOgogIHJlc29sdmVfdGltZW91dDogNW0Kcm91dGU6CiAgcmVjZWl2ZXI6ICdlbWFpbC1hbGVydCcK
Edit the Alert Manager secret with the string generated with the command above:
$ kubectl patch secret -n monitoring alertmanager-prometheus-operator-kube-p-alertmanager -p='{"data":{"alertmanager.yaml": "Z2xvYmFsOgogIHJlc29sdmVfdGltZW91dDogNW0Kcm91dGU6CiAgcmVjZWl2ZXI6ICdlbWFpbC1hbGVydCcK"}}' -v=1
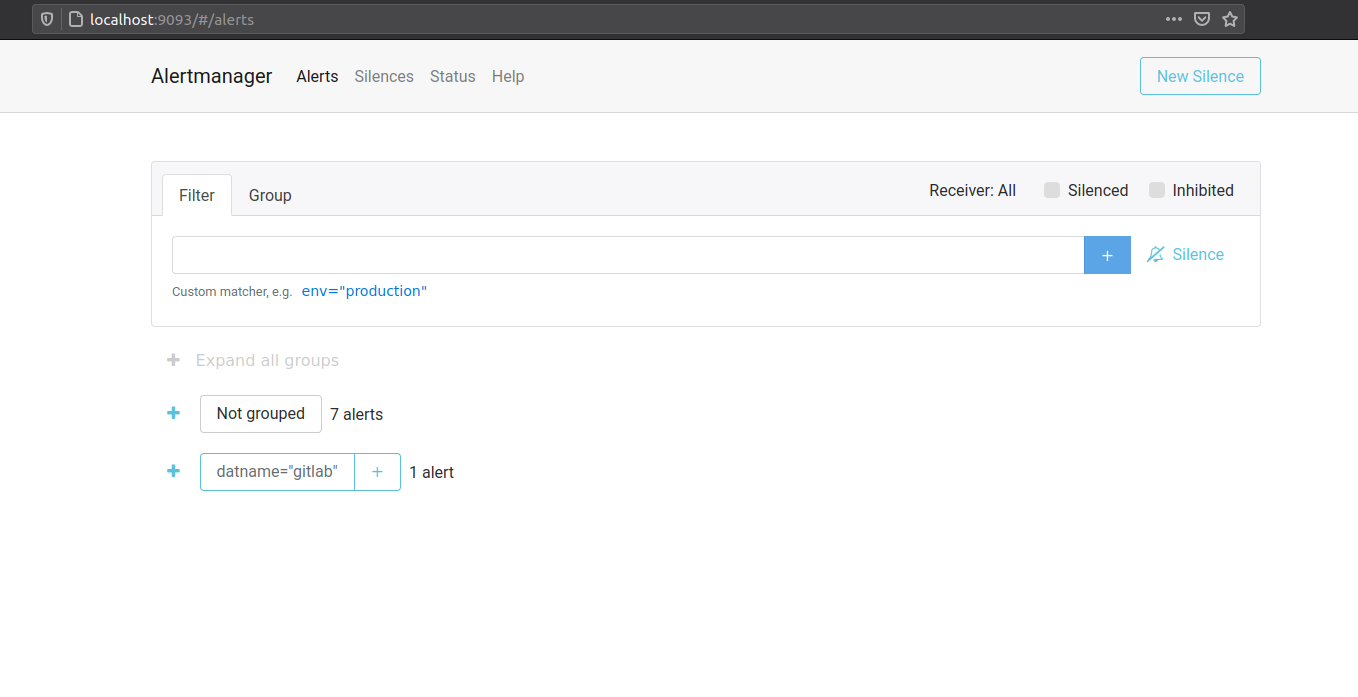
After a few seconds, the new configuration will be applied. You can verify it by accessing the Alert Manager console, with:
kubectl port-forward -n monitoring alertmanager-prometheus-operator-kube-p-alertmanager-0 9093:9093
Then open your web browser at: http://localhost:9093
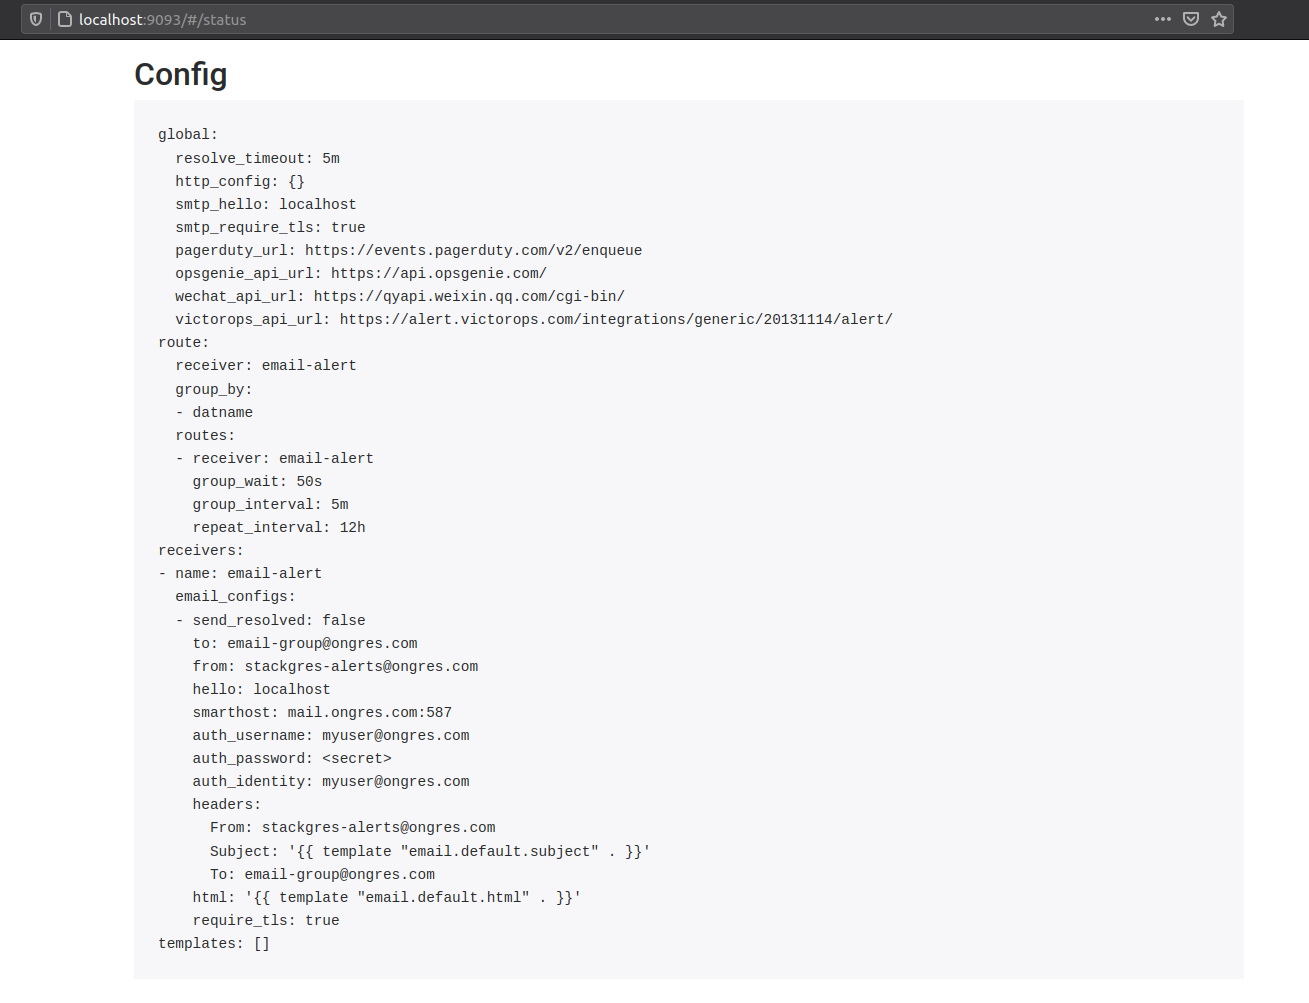
Now, go to the Status section and verify that your changes were applied:
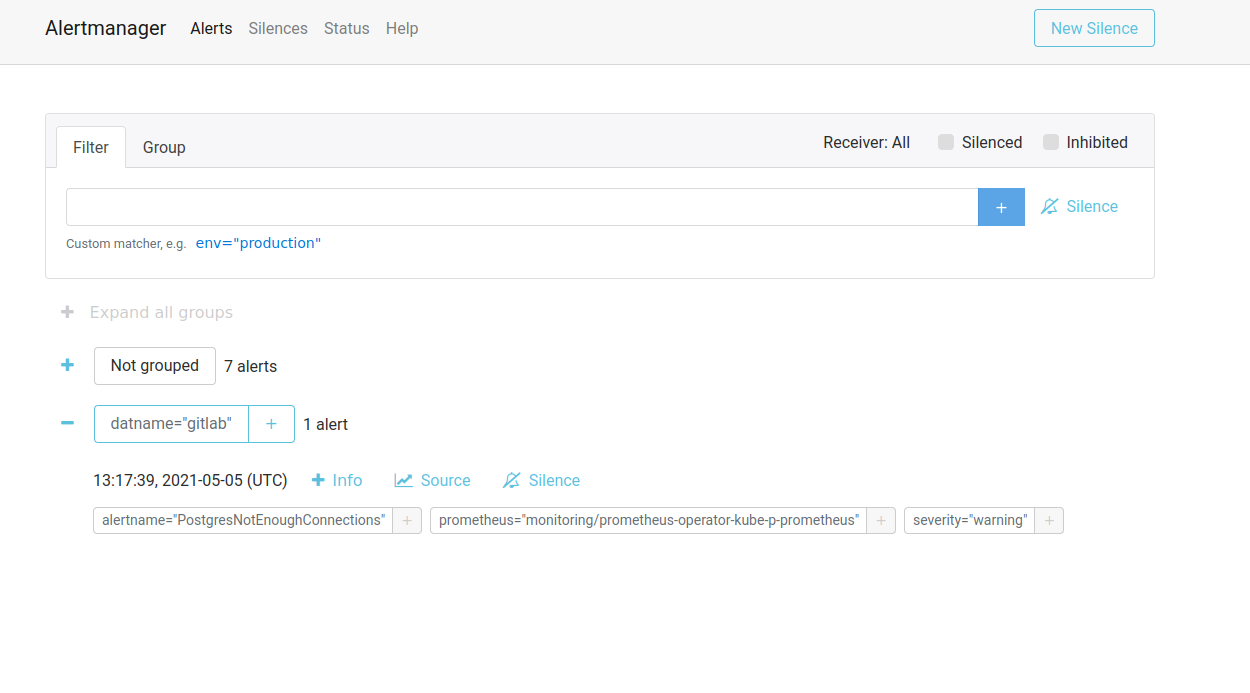
If there’s an active alert on your cluster, you should see it in the Alert Manager console:
And if the email configuration and credentials you provide are OK, you’ll receive an email:
